How do I read a histogram? (EOS DIGITAL REBEL XS/EOS 1000D)
Solution
A histogram is a graph that shows the frequency distribution of an image's data values, which makes it convenient for checking an image's brightness or darkness or the trends in the colors it uses.
With this camera, you can use the histogram to check the following.
- Brightness Display:Trends in exposure levels and overall gradations
- RGB Display:Color saturation and gradation
For information on how to display the histogram, please refer to "How do I display shooting infomation during playback? (EOS DIGITAL REBEL XS/EOS 1000D)".
Note that you can switch between the [Brightness] and [RGB] displays using the menu displayed on the LCD monitor.
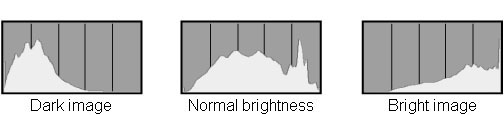
This histogram shows the distribution of brightness in an image as a graph of brightness along the horizontal axis (Left: Dark; Right: Bright) and a stack of the number of pixels at each level of brightness along the vertical axis.
Within the screen, the peaks in the graph will skew more to the left the greater the dark components of the image there are, and will skew more to the right of the graph the greater the bright components of the image there are. Components up against the left edge of the horizontal axis are crushed blacks, and components up against the right edge are blown highlights. The components in other areas reproduce gradations.
By looking at an image and its histogram, you can check the exposure level and the overall gradation in the image.
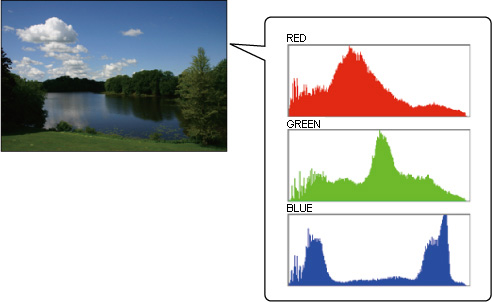
This histogram shows the distribution of brightness in an image as a graph of brightness along the horizontal axis (Left: Dark; Right: Bright) and a stack of the number of pixels at each level of brightness for each of the R (Red)/G (Green)/B (Blue) colors along the vertical axis.
Within the screen, the peaks in the graph will skew more to the left the greater the darker, thin colors of the image there are, and will skew more to the right of the graph the greater the brighter, dense colors of the image there are. Components up against the left edge of the horizontal axis have little or no color information, and components up against the right edge are saturated, with no gradation. By looking at an RGB histogram, you can check the saturation of color and the gradations in the image.
To switch between the [Brightness] and [RGB] displays, follow the procedure below.
1. Turn the camera's power switch to <ON>.
2. Press the <MENU> button to bring up the menu.
3. Select the histogram to display.
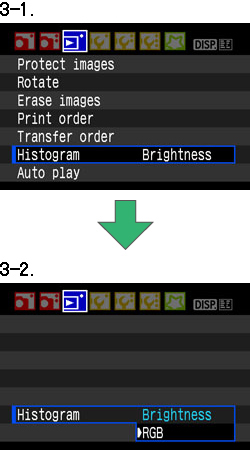
3-1. After pressing the <cross keys> to select the [  ] tab, press the cross keys to select [Histogram].
] tab, press the cross keys to select [Histogram]. 3-2. Press the <SET> button, and then press the cross keys to select either [Brightness] or [RGB].
3-3. Press the <SET> button.
4. Press the <MENU> button to turn off the LCD monitor.
This completes the process of changing the histogram display.